The 21-Mile Wide Panic Button
I’ve been staring at a digital map of the Persian Gulf for three hours, watching tiny yellow triangles represent tankers carrying nearly 30% of the world’s liquefied natural gas. The Strait of Hormuz is only 21 miles wide at its narrowest point, a geographical fluke that holds the global economy by the throat. What’s fascinating isn't just the fragility of that passage, but the fact that I can now model its total collapse from a coffee shop without asking a single analyst at Goldman Sachs for permission.
In the past, understanding the ripple effects of a maritime blockade required a classified briefing or a million-dollar subscription to a proprietary terminal. Today, we have 'Digital Twins'—high-fidelity simulations built on open-source trade data—that allow us to stress-test the planet. When you run a simulation that halts traffic through that strait, you aren't just looking at a static map; you’re watching a living, breathing system of supply and demand react in real-time. It makes me wonder: if the data is this accessible, why are we still so often surprised when things go wrong?
The Democratization of the Chokepoint
There is something deeply strange about the shift in information power. For decades, the 'institutional commodity desk' was a black box where Ivy League graduates used private satellite feeds to predict oil price spikes. Now, an independent data scientist can scrape Automatic Identification System (AIS) data—the GPS for ships—and build a model that is arguably more granular than what the big banks are using.
We are moving into an era where 'market intelligence' is no longer about who you know, but how well you can code a simulation. In my recent run, I factored in the 20.5 million barrels of oil that pass through the strait daily. By tweaking the 'closure duration' variable to 14 days, the model didn't just show a price hike; it showed the specific refineries in South Korea and India that would run dry first. This level of precision used to be a state secret. Now, it's a GitHub repository.

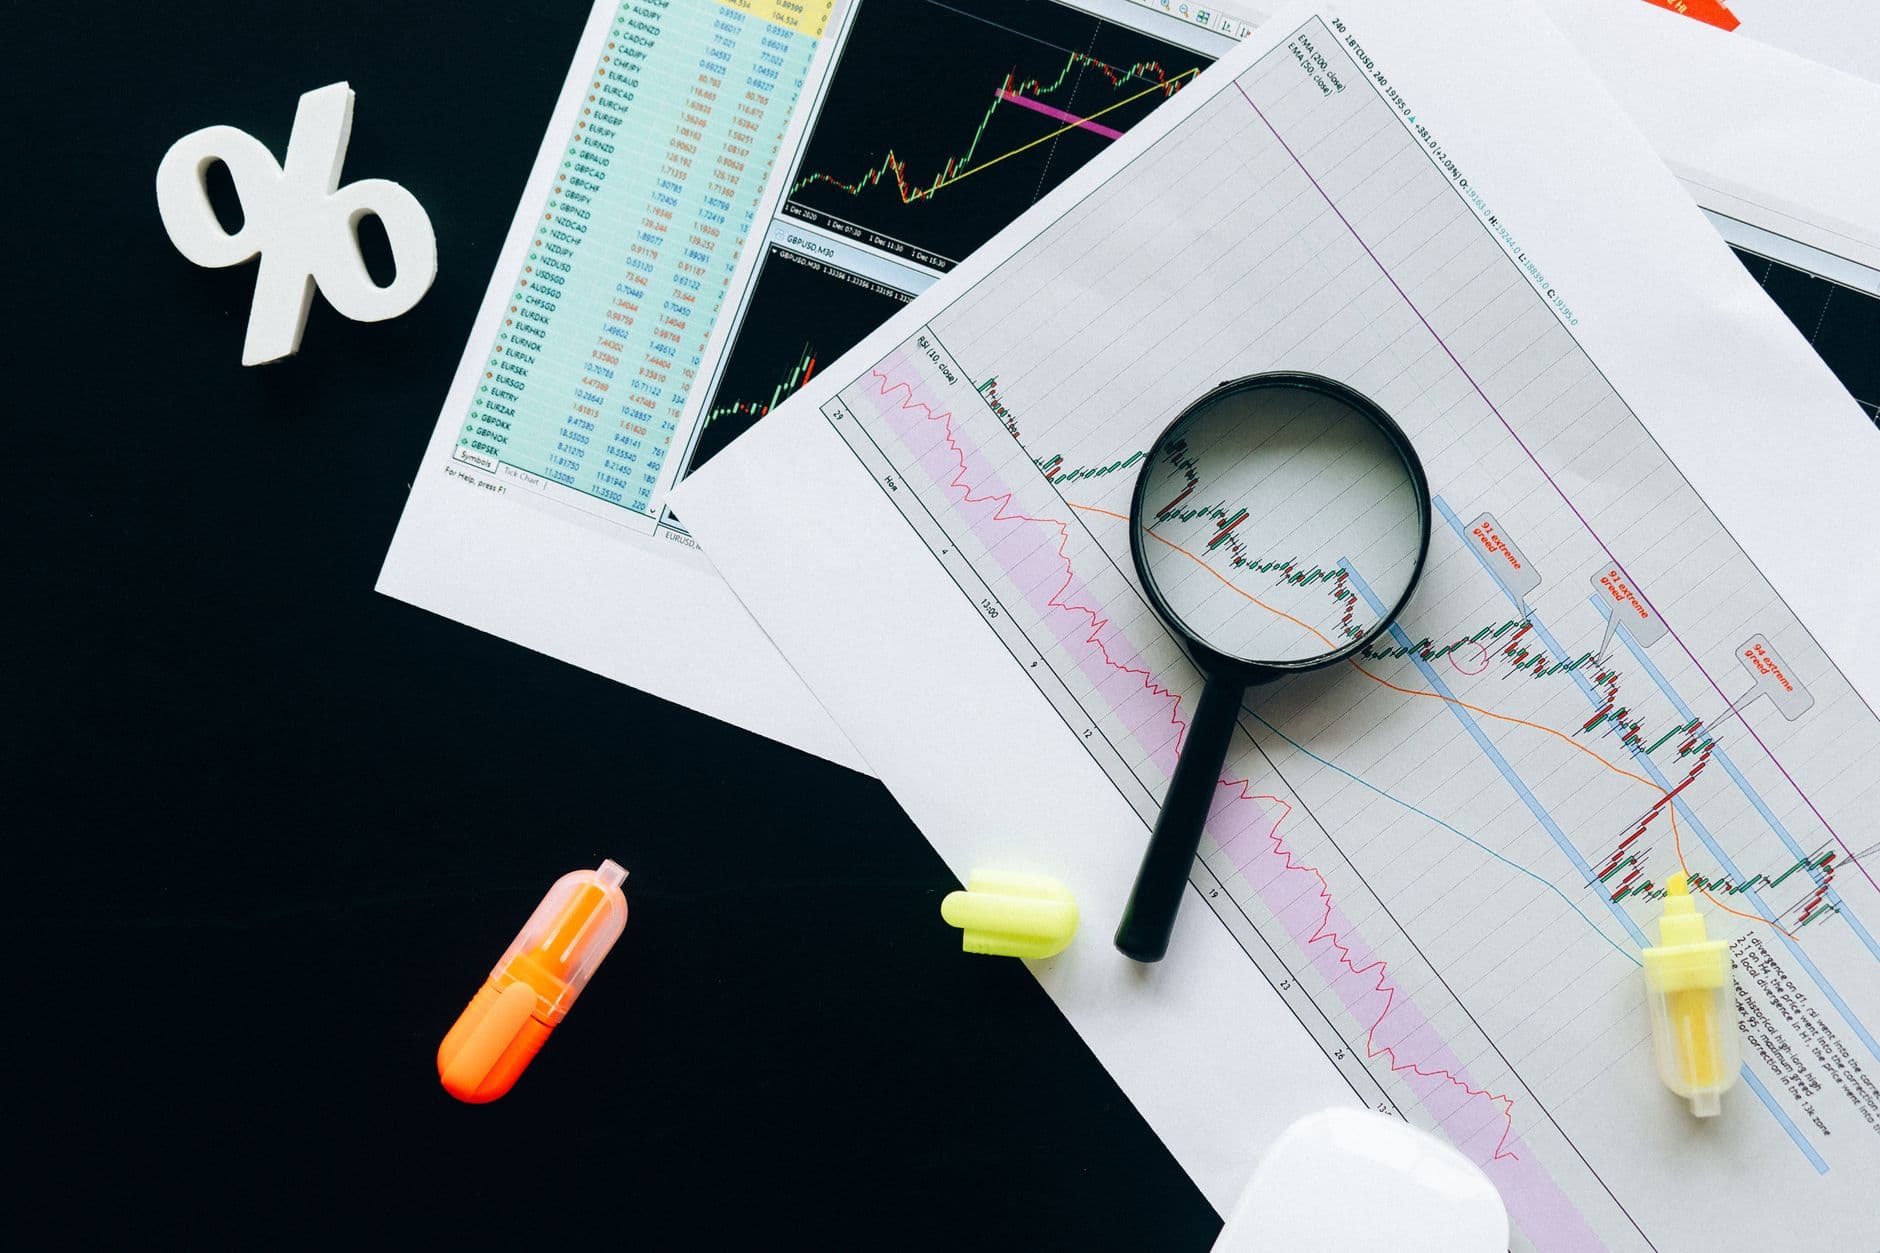
Photo by Szymon Shields on Pexels
Why Precision Beats Forecasting
Traditional bank forecasts are often based on historical precedent and 'sentiment,' which is a fancy word for guessing how people will feel. Digital twins operate on physics and logistics. They don't care about market 'moods'; they care about the draft of a Suezmax tanker and the speed of a current. When you simulate a chokepoint closure, you see the physical impossibility of rerouting 5,000 ships around the Cape of Good Hope simultaneously.
- The Cape route adds roughly 15 days to a journey from the Gulf to Europe.
- Fuel costs for a single diverted VLCC (Very Large Crude Carrier) can jump by $500,000.
- Global shipping capacity effectively shrinks because ships are stuck at sea longer.
Seeing these numbers click into place makes me realize that our global economy isn't a solid structure. It’s more like a highly complex, incredibly fast-moving fluid. If you know the viscosity of the fluid and the diameter of the pipe, you don't need a crystal ball. You just need a better calculator. I find myself wondering if the volatility we see in the markets is actually just the gap between those who have run the simulation and those who are still reading the headlines.
The Ghost in the Machine
If anyone can model a global crisis, does that make the crisis more or less likely to happen? There’s a psychological layer here that I haven't quite figured out. If every trader sees the same simulation results simultaneously, the 'rational' reaction—hoarding, price-gouging, or panic-selling—happens instantly. The speed of information might actually be making the system more brittle, not more resilient.
I’m curious about the 'unknown unknowns' that these models still miss. A digital twin can tell me where the oil is, but it can’t tell me what a captain will do when he sees a drone on the horizon. It can't model the political ego of a mid-level bureaucrat. We have perfected the 'what' and the 'where' of global trade, but the 'why' remains as messy and human as ever. Even with the best data, we are still just observers trying to predict the path of a storm we helped create.
What This Actually Means
The wall between 'expert' and 'observer' is effectively gone. When a single person with a laptop can out-model a multi-billion dollar institution, the very definition of market authority changes. We are entering a period of radical transparency where the physical constraints of the world—the width of a canal, the depth of a port, the speed of a pump—become the only data points that actually matter.
This shift moves us away from 'theories' of economics and toward a hard-coded reality. If you want to know what happens to the price of your gasoline, don't listen to a pundit. Look at the AIS pings. The truth isn't in a press release; it’s in the coordinates of a ship currently idling in the Gulf of Oman. We have the tools to see the world as it really is, which is both empowering and terrifyingly clear.
Quick Answers
What is a supply chain digital twin?
It is a virtual, data-driven map of the physical world that uses real-time shipping, inventory, and weather data to simulate how disruptions affect the flow of goods.
Can these models actually predict oil prices?
They can't predict the exact dollar amount, but they can predict the exact timing and location of supply shortages, which inevitably drives the price.
Why is this better than what banks do?
Banks often rely on lagging economic indicators, while digital twins use real-time physical data like ship GPS coordinates, which move faster than any government report.